crwdns2935425:09crwdne2935425:0
crwdns2931653:09crwdne2931653:0
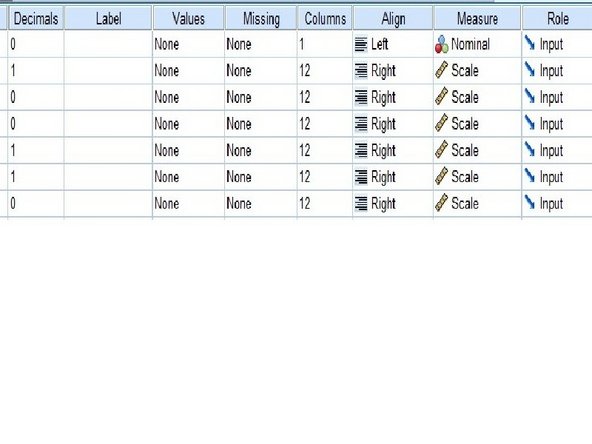
Understanding Variable View Continued
-
The seventh column, “Missing,” allows a choice of including or excluding values from analysis.
-
The eighth column, “Columns,” indicates the number of columns a variable has.
-
The ninth column, “Align,” indicates the alignment of the variables.
-
The tenth column, “Measure,” indicates the level of measurement of the variable.
-
The last column, “Role,” defines the role the variable will play in the analysis.
crwdns2944171:0crwdnd2944171:0crwdnd2944171:0crwdnd2944171:0crwdne2944171:0