crwdns2935425:06crwdne2935425:0


-
Use an existing Dashboard (i.e. Abhis Hostage Nodes) or create one.
-
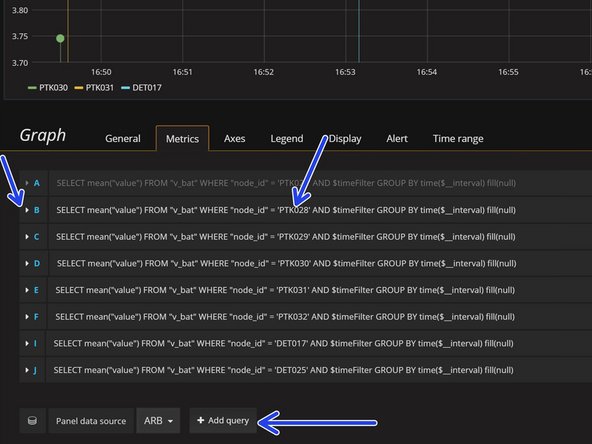
To enter the edit panel click the header and it will appear. If you created a new dashboard, then you must create a 'v_bat' panel and a 'maxbotix_depth' panel. They should be labeled to indicate battery voltage and depth. Always save changes frequently.
-
Once inside the edit panel: It's possible to edit an already existing entry and only update the Node ID and alias. Alternatively can click on 'add query'. When adding a new query get an admin to supervise while you do it.
-
Use this dashboard exclusively for testing and delete already deployed nodes. Sensors that have been deployed should be promoted to their permanent Grafana Dashboard. i.e: Cinton River, Huron River,...
crwdns2944171:0crwdnd2944171:0crwdnd2944171:0crwdnd2944171:0crwdne2944171:0